 |
| Market Cap | 91.68M | EPS (ttm) | -1.31 |
| P/E | - | EPS this Y | 30.92% |
| Forward P/E | - | EPS next Y | 100.00% |
| PEG | - | EPS past 5Y | 48.72% |
| P/S | 1.36 | EPS next 5Y | - |
| P/B | 1.83 | EPS Q/Q | 54.24% |
| Dividend | - | Sales Q/Q | 153.65% |
| Insider Own | 7.90% | Inst Own | 18.32% |
| Insider Trans | 0.00% | Inst Trans | -10.64% |
| Short Float | 13.08% | Earnings | May 20/a |
| Analyst Recom | 1.40 | Target Price | 17.75 |
| Avg Volume | 94.62K | 52W Range | 5.00 - 13.66 |
|
|
|
|
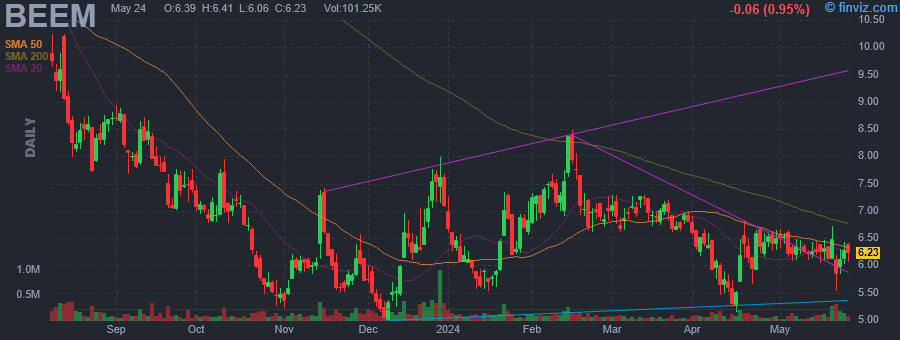
Beam Global provides sustainable products and technologies for electric vehicle (EV) charging, energy storage, energy security and outdoor media. It develops, patents, designs, engineers and manufactures unique and advanced clean mobility solutions that protect the environment, save customers time and money, empower communities and keep people moving. The firm's core platforms include Beam EV ARC and Solar Tree sustainable EV charging systems, Beam AllCell high-performance energy storage solutions, energy resiliency and disaster preparedness products and a deep patent library. The company was founded by Robert Lane Noble on June 12, 2006 and is headquartered in San Diego, CA. |
| Insider Trading |
Relationship |
Date |
Transaction |
Cost |
#Shares |
Value ($) |
#Shares Total |
SEC Form 4 |
| WHEATLEY DESMOND C | Chief Executive Officer | Oct 02 '23 | Sale | 7.35 | 620 | 4,557 | 100,929 | Oct 05 06:01 PM | | WHEATLEY DESMOND C | Chief Executive Officer | Jun 01 '23 | Sale | 11.81 | 1,400 | 16,534 | 101,549 | Jun 02 07:32 PM |
|
|
 |
 |
| Market Cap | 1.25B | EPS (ttm) | -0.77 |
| P/E | - | EPS this Y | - |
| Forward P/E | - | EPS next Y | - |
| PEG | - | EPS past 5Y | - |
| P/S | - | EPS next 5Y | - |
| P/B | - | EPS Q/Q | - |
| Dividend | 10.75% | Sales Q/Q | - |
| Insider Own | 0.42% | Inst Own | 19.63% |
| Insider Trans | 3.81% | Inst Trans | - |
| Short Float | 0.02% | Earnings | May 20/a |
| Analyst Recom | - | Target Price | - |
| Avg Volume | 649.85K | 52W Range | 4.30 - 6.28 |
|
|
|
|
FS Credit Opportunities Corp. is a close ended fixed income fund launched by Franklin Square Capital Partners. The fund is co-managed by FS Global Advisor, LLC and GSO Capital Partners LP. It invests in fixed income markets across the globe, with a strong focus on Europe and the United States. The fund seeks to invest in securities of companies that are operating across diversified sectors. It primarily invests in global credit, including secured and unsecured floating and fixed rate loans, bonds, and other credit instruments that companies use to finance their operations. The fund seeks to generate total return by employing an event-driven approach that focuses on companies that are undervalued by the market. It seeks companies that are expected to benefit from corporate events such as mergers, acquisitions, or corporate reorganizations. FS Credit Opportunities Corp. was formed on January 28, 2013 and is domiciled in the United States. |
| Insider Trading |
Relationship |
Date |
Transaction |
Cost |
#Shares |
Value ($) |
#Shares Total |
SEC Form 4 |
| Nix Robert N.C. III | Director | Mar 19 '24 | Buy | 5.96 | 4,100 | 24,435 | 8,395 | Mar 22 04:21 PM | | Forman Michael C. | Chief Executive Officer | Mar 19 '24 | Sale | 5.87 | 1 | 6 | 63,635 | Mar 20 03:56 PM | | Fouss Barbara J | Director | Mar 18 '24 | Buy | 5.87 | 11,000 | 64,556 | 21,130 | Mar 20 02:14 PM | | Bethel Keith | Director | Mar 13 '24 | Buy | 5.80 | 6,500 | 37,681 | 11,500 | Mar 15 04:11 PM | | Bethel Keith | Director | Mar 13 '24 | Buy | 5.80 | 2,500 | 14,498 | 2,500 | Mar 15 04:11 PM |
|
|
|
 |
| Market Cap | 18.06M | EPS (ttm) | -4.65 |
| P/E | - | EPS this Y | 89.79% |
| Forward P/E | - | EPS next Y | 82.76% |
| PEG | - | EPS past 5Y | 62.42% |
| P/S | 0.39 | EPS next 5Y | - |
| P/B | 0.52 | EPS Q/Q | 89.87% |
| Dividend | - | Sales Q/Q | 41.06% |
| Insider Own | 52.61% | Inst Own | 26.27% |
| Insider Trans | 0.00% | Inst Trans | - |
| Short Float | 0.70% | Earnings | May 20/a |
| Analyst Recom | 1.00 | Target Price | 5.00 |
| Avg Volume | 145.00K | 52W Range | 1.23 - 4.69 |
|
|
|
|
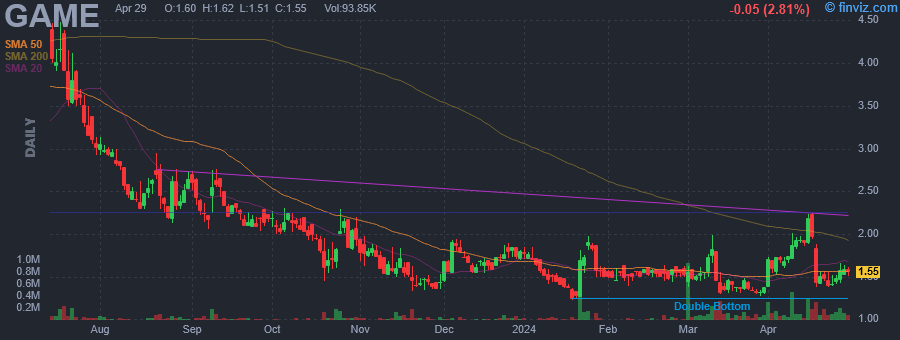
GameSquare Holdings, Inc. is an international digital media, entertainment and technology company. It engages in enabling global brands to connect with gaming and youth culture audiences. It's platform includes Code Red Esports Ltd., Cut+Sew (Zoned), Complexity Gaming, Fourth Frame Studios, Mission Supply, Frankly Media, Stream Hatchet, and Sideqik. The company was founded on April 8, 2011and is headquartered in Toronto, Canada. |
|
| |
 |
| Market Cap | 514.97M | EPS (ttm) | -0.53 |
| P/E | - | EPS this Y | 55.85% |
| Forward P/E | 67.20 | EPS next Y | 133.77% |
| PEG | - | EPS past 5Y | -27.73% |
| P/S | 1.95 | EPS next 5Y | - |
| P/B | 1.15 | EPS Q/Q | -1.05% |
| Dividend | - | Sales Q/Q | 35.02% |
| Insider Own | 17.93% | Inst Own | 11.40% |
| Insider Trans | 0.00% | Inst Trans | - |
| Short Float | 3.37% | Earnings | May 20/a |
| Analyst Recom | 1.33 | Target Price | 10.29 |
| Avg Volume | 790.28K | 52W Range | 3.28 - 13.98 |
|
|
|
|
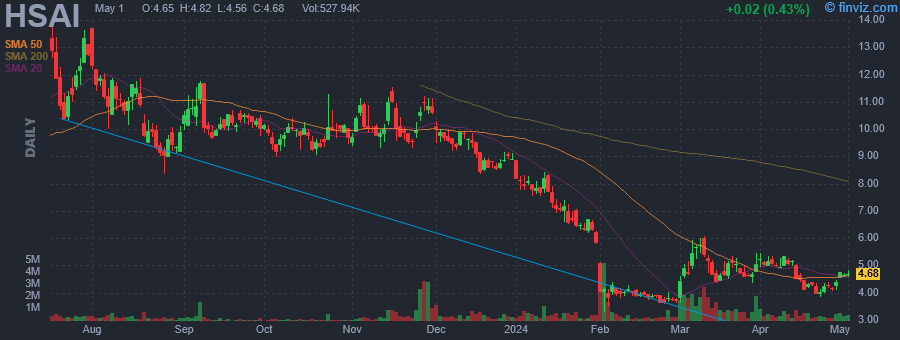
Hesai Group engages in the development, manufacture and sale of three-dimensional light detection and ranging solutions. The firm is also involved in the research, development, and design of LiDAR. It operates through the Light Detection and Ranging (LiDAR), and Gas Detection segments. The company was founded by Yi Fan Li, Kai Sun, and Shao Qing Xiang in October 2014 and is headquartered in Shanghai, China. |
|
|
 |
| Market Cap | 16.09B | EPS (ttm) | 1.22 |
| P/E | 30.34 | EPS this Y | 19.22% |
| Forward P/E | 21.06 | EPS next Y | 8.15% |
| PEG | 2.45 | EPS past 5Y | 28.15% |
| P/S | 4.17 | EPS next 5Y | 12.40% |
| P/B | 8.49 | EPS Q/Q | 47.50% |
| Dividend | - | Sales Q/Q | 13.65% |
| Insider Own | - | Inst Own | 1.82% |
| Insider Trans | - | Inst Trans | 8.71% |
| Short Float | 0.01% | Earnings | May 20/a |
| Analyst Recom | 2.36 | Target Price | 38.21 |
| Avg Volume | 37.55K | 52W Range | 24.18 - 41.98 |
|
|
|
|
James Hardie Industries Plc engages in the manufacture of fiber cement siding and backer board. It operates through the following segments: North America Fiber Cement, Asia Pacific Fiber Cement, Europe Building Products, and Research & Development. The North America Fiber Cement segment manufactures fiber cement interior linings, exterior siding products and related accessories in the United States. The Asia Pacific Fiber Cement segment includes all fiber cement products manufactured in Australia and the Philippines, and sold in Australia, New Zealand, Asia, the Middle East and Pacific Islands. The Europe Building Products segment encompasses the Fermacell business and fiber cement product manufactured in the United States that is sold in Europe. The Research and Development segment represents the cost incurred by the research and development centers. The company was founded in 1888 and is headquartered in Dublin, Ireland. |
|
| |
 |
| Market Cap | 28.07B | EPS (ttm) | 5.44 |
| P/E | 29.54 | EPS this Y | -26.75% |
| Forward P/E | 22.13 | EPS next Y | 19.11% |
| PEG | 6.81 | EPS past 5Y | 46.88% |
| P/S | 5.25 | EPS next 5Y | 4.34% |
| P/B | 5.84 | EPS Q/Q | -32.34% |
| Dividend | - | Sales Q/Q | -8.83% |
| Insider Own | 0.80% | Inst Own | 89.44% |
| Insider Trans | -6.92% | Inst Trans | -3.16% |
| Short Float | 2.03% | Earnings | May 20/a |
| Analyst Recom | 2.09 | Target Price | 162.33 |
| Avg Volume | 1.25M | 52W Range | 118.57 - 172.72 |
|
|
|
|
Keysight Technologies, Inc. engages in the provision of electronic design and test solutions that are used in the design, development, manufacture, installation, deployment, validation, optimization and secure operation of electronics systems to communications, networking and electronics industries. It operates through the following segments: Communications Solutions Group, and Electronic Industrial Solutions Group. The Communications Solutions Group segment serves customers spanning the worldwide commercial communications end market, which includes internet infrastructure, and the aerospace, defense and government end market. The Electronic Industrial Solutions Group segment offers test and measurement solutions across a broad set of electronic industrial end markets, focusing on high-growth applications in the automotive and energy industry and measurement solutions for semiconductor design and manufacturing, consumer electronics, education, and general electronics manufacturing. The company was founded by William R. Hewlett and David Packard in 1937 and is headquartered in Santa Rosa, CA. |
| Insider Trading |
Relationship |
Date |
Transaction |
Cost |
#Shares |
Value ($) |
#Shares Total |
SEC Form 4 |
| NARAYANAN KAILASH | SVP | Mar 26 '24 | Sale | 152.88 | 4,300 | 657,384 | 29,156 | Mar 28 04:17 PM | | Nersesian Ronald S. | Director | Dec 27 '23 | Sale | 159.82 | 29,672 | 4,742,179 | 296,619 | Dec 28 04:04 PM | | Dougherty Neil | EVP and CFO | Dec 15 '23 | Sale | 159.35 | 14,686 | 2,340,214 | 106,793 | Dec 18 05:36 PM | | NARAYANAN KAILASH | SVP | Dec 15 '23 | Sale | 159.16 | 1,006 | 160,117 | 33,456 | Dec 18 05:36 PM | | Ee Huei Sin | SVP | Dec 14 '23 | Sale | 156.47 | 5,000 | 782,325 | 44,317 | Dec 15 05:45 PM |
|
|
|
 |
| Market Cap | 15.53B | EPS (ttm) | 8.56 |
| P/E | 31.73 | EPS this Y | 13.26% |
| Forward P/E | 24.24 | EPS next Y | 9.57% |
| PEG | 2.44 | EPS past 5Y | 5.72% |
| P/S | 5.86 | EPS next 5Y | 13.00% |
| P/B | 5.70 | EPS Q/Q | 5.47% |
| Dividend | 1.02% | Sales Q/Q | 3.72% |
| Insider Own | 10.29% | Inst Own | 73.59% |
| Insider Trans | -0.17% | Inst Trans | -0.80% |
| Short Float | 1.86% | Earnings | May 20/a |
| Analyst Recom | 2.60 | Target Price | 296.20 |
| Avg Volume | 233.52K | 52W Range | 208.90 - 279.38 |
|
|
|
|
Nordson Corp. engages in the engineering, manufacture and market of products and systems used for adhesives, coatings, sealants, biomaterials and other materials. It operates through the following segments: Industrial Precision Solutions and Advanced Technology Solution. The Industrial Precision Solutions segment enhances the technology synergies between adhesive dispensing systems and industrial coating systems to deliver proprietary dispensing and processing technology to diverse end markets. The Advanced Technology Solution segment integrates proprietary product technologies found in progressive stages of a customer's production processes, such as surface treatment, precisely controlled dispensing of material and post-dispense test and inspection to ensure quality. The company was founded by Eric T. Nord, Evan W. Nord and Walter G. Nord in 1954 and is headquartered in Westlake, OH. |
| Insider Trading |
Relationship |
Date |
Transaction |
Cost |
#Shares |
Value ($) |
#Shares Total |
SEC Form 4 |
| Subramanian Srinivas | Executive Vice President | Jan 12 '24 | Option Exercise | 70.91 | 2,100 | 148,911 | 6,665 | Jan 16 12:15 PM | | Subramanian Srinivas | Executive Vice President | Jan 12 '24 | Sale | 250.79 | 2,100 | 526,659 | 4,565 | Jan 16 12:15 PM | | Subramanian Srinivas | Executive Vice President | Jan 11 '24 | Option Exercise | 79.66 | 1,400 | 111,524 | 5,965 | Jan 16 12:15 PM | | Subramanian Srinivas | Executive Vice President | Jan 11 '24 | Sale | 250.00 | 1,400 | 350,000 | 4,565 | Jan 16 12:15 PM | | Lovass Stephen | Executive Vice President | Jan 09 '24 | Sale | 250.13 | 1,213 | 303,408 | 7,379 | Jan 10 07:57 PM |
|
|
| |
 |
| Market Cap | 103.06B | EPS (ttm) | 6.40 |
| P/E | 49.87 | EPS this Y | 24.28% |
| Forward P/E | 51.51 | EPS next Y | 12.23% |
| PEG | 3.07 | EPS past 5Y | - |
| P/S | 13.69 | EPS next 5Y | 16.25% |
| P/B | 23.62 | EPS Q/Q | 1824.54% |
| Dividend | - | Sales Q/Q | 19.33% |
| Insider Own | 1.25% | Inst Own | 78.94% |
| Insider Trans | -23.60% | Inst Trans | -1.29% |
| Short Float | 3.54% | Earnings | May 20/a |
| Analyst Recom | 1.71 | Target Price | 335.52 |
| Avg Volume | 5.99M | 52W Range | 186.75 - 380.84 |
|
|
|
|
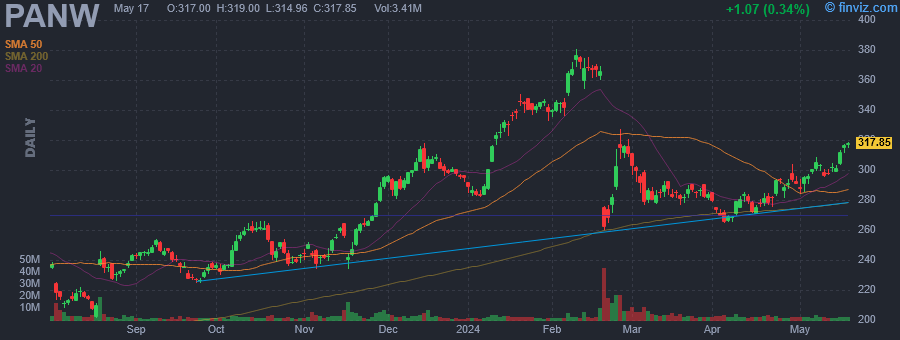
Palo Alto Networks, Inc. engages in the provision of network security solutions to enterprises, service providers, and government entities. It operates through the following geographical segments: the United States, Israel, and Other Countries. The company was founded by Nir Zuk in March 2005 and is headquartered in Santa Clara, CA. |
| Insider Trading |
Relationship |
Date |
Transaction |
Cost |
#Shares |
Value ($) |
#Shares Total |
SEC Form 4 |
| Klarich Lee | EVP, Chief Product Officer | May 07 '24 | Option Exercise | 64.50 | 5,391 | 347,737 | 171,933 | May 08 04:30 PM | | Klarich Lee | EVP, Chief Product Officer | May 07 '24 | Sale | 304.70 | 5,391 | 1,642,647 | 166,542 | May 08 04:30 PM | | Klarich Lee | EVP, Chief Product Officer | May 06 '24 | Option Exercise | 64.50 | 121,276 | 7,822,702 | 287,818 | May 08 04:30 PM | | Klarich Lee | EVP, Chief Product Officer | May 06 '24 | Sale | 299.60 | 121,276 | 36,334,450 | 166,542 | May 08 04:30 PM | | ZUK NIR | EVP, Chief Technology Officer | May 01 '24 | Sale | 288.24 | 36,000 | 10,376,810 | 1,295,567 | May 03 04:30 PM |
|
|
|
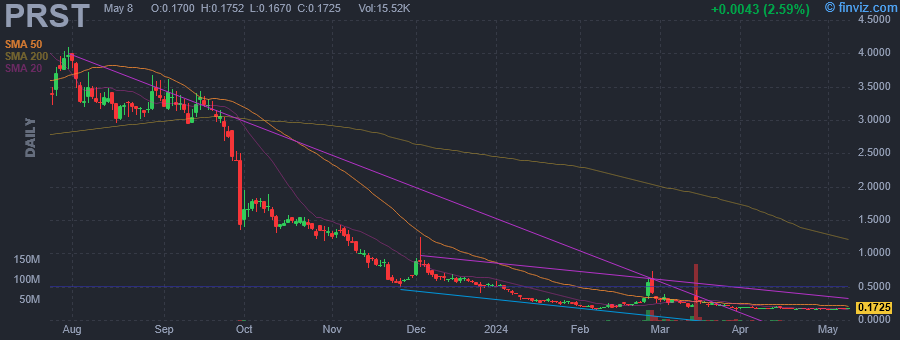 |
| Market Cap | 21.54M | EPS (ttm) | -1.17 |
| P/E | - | EPS this Y | - |
| Forward P/E | - | EPS next Y | - |
| PEG | - | EPS past 5Y | -827.96% |
| P/S | 1.02 | EPS next 5Y | - |
| P/B | - | EPS Q/Q | 7.94% |
| Dividend | - | Sales Q/Q | -33.45% |
| Insider Own | 39.89% | Inst Own | 6.47% |
| Insider Trans | -0.15% | Inst Trans | 90.63% |
| Short Float | 2.76% | Earnings | May 20/a |
| Analyst Recom | 3.00 | Target Price | 0.25 |
| Avg Volume | 4.94M | 52W Range | 0.14 - 5.74 |
|
|
|
|
Presto Automation, Inc. engages in the provision of enterprise-grade artificial intelligence (AI) and solutions to the restaurant industry. It focuses on its Presto Voice AI. The company was founded by Rajat Suri in 2008 and is headquartered in San Carlos, CA. |
| Insider Trading |
Relationship |
Date |
Transaction |
Cost |
#Shares |
Value ($) |
#Shares Total |
SEC Form 4 |
| Kravcik Keith E | Director | Dec 08 '23 | Sale | 0.62 | 22,687 | 14,066 | 400,000 | Dec 11 01:10 PM | | Kravcik Keith E | Director | Dec 07 '23 | Sale | 0.66 | 15,800 | 10,428 | 422,687 | Dec 11 01:10 PM | | Mosher Dan | PRESIDENT | Nov 24 '23 | Sale | 0.57 | 23,334 | 13,279 | 279,779 | Nov 27 06:05 PM | | Cleveland Avenue Food & Bevera | 10% Owner | Oct 16 '23 | Buy | 2.00 | 1,500,000 | 3,000,000 | 10,000,000 | Oct 26 09:36 PM | | Mosher Dan | PRESIDENT | Sep 25 '23 | Sale | 2.82 | 7,117 | 20,070 | 303,113 | Sep 27 04:54 PM |
|
|
|
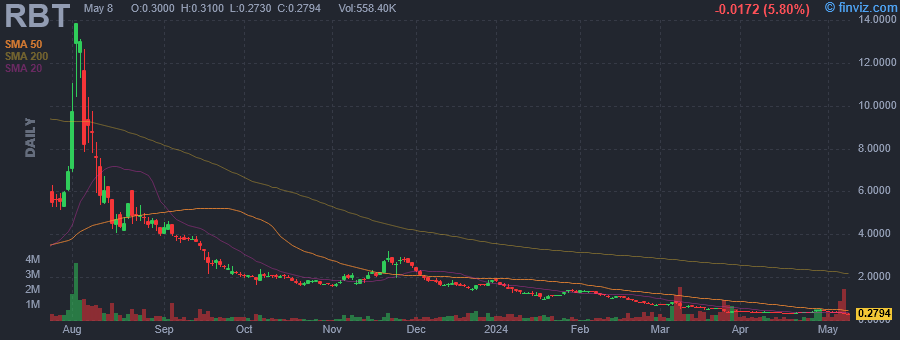 |
| Market Cap | 15.72M | EPS (ttm) | -2.61 |
| P/E | - | EPS this Y | 70.40% |
| Forward P/E | - | EPS next Y | 50.00% |
| PEG | - | EPS past 5Y | - |
| P/S | 0.02 | EPS next 5Y | - |
| P/B | - | EPS Q/Q | 82.41% |
| Dividend | - | Sales Q/Q | 2.81% |
| Insider Own | 40.33% | Inst Own | 16.52% |
| Insider Trans | -1.29% | Inst Trans | 23.64% |
| Short Float | 1.10% | Earnings | May 20/a |
| Analyst Recom | 1.00 | Target Price | 1.60 |
| Avg Volume | 561.41K | 52W Range | 0.19 - 13.84 |
|
|
|
|
Rubicon Technologies, Inc. engages in the operation of a digital marketplace that provides a suite of software products for waste, recycling, and smart city solutions. It operates through the following segments: Collection, Transfer, Landfill, Recycling, and Waste and Recycling Brokerage. The Collection segment is involved in collecting and transporting waste and recyclable materials from either commercial or residential communities to transfer stations, material recovery facilities or disposal sites. The Transfer segment focuses on reducing volume and making the transport to disposal sites more efficient. The Landfill segment includes municipal solid waste facilities that collect and bury whatever isn't sent to MRFs and are the main depositories for solid waste in North America. The Recycling segment offers facilities that extract reusable commodities out of waste to be repurposed for future use. The Waste and Recycling Brokerage segment engages in third parties that work on behalf of businesses to pair them with suitable waste hauling and recycling services. The company was founded by Nathaniel Morris in 2008 and is headquartered in Atlanta, GA. |
| Insider Trading |
Relationship |
Date |
Transaction |
Cost |
#Shares |
Value ($) |
#Shares Total |
SEC Form 4 |
| Palantir Technologies Inc. | Former 10% Owner | Apr 24 '24 | Sale | 0.37 | 18,621 | 6,972 | 5,233,625 | Apr 24 08:25 PM | | Palantir Technologies Inc. | Former 10% Owner | Apr 23 '24 | Sale | 0.37 | 18,471 | 6,792 | 5,252,246 | Apr 24 08:25 PM | | Palantir Technologies Inc. | Former 10% Owner | Apr 22 '24 | Sale | 0.34 | 3,200 | 1,089 | 5,270,717 | Apr 24 08:25 PM | | Palantir Technologies Inc. | 10% Owner | Apr 19 '24 | Sale | 0.34 | 12,086 | 4,143 | 5,273,917 | Apr 19 09:09 PM | | Palantir Technologies Inc. | 10% Owner | Apr 18 '24 | Sale | 0.33 | 16,140 | 5,283 | 5,286,003 | Apr 19 09:09 PM |
|
|
|
